Breifly Exploring the Reviews from Yelp Dataset 
Han Zhang
1. Business Understanding
The Yelp dataset is a subset of its businesses, reviews, and user data for use in personal, educational, and academic purposes.
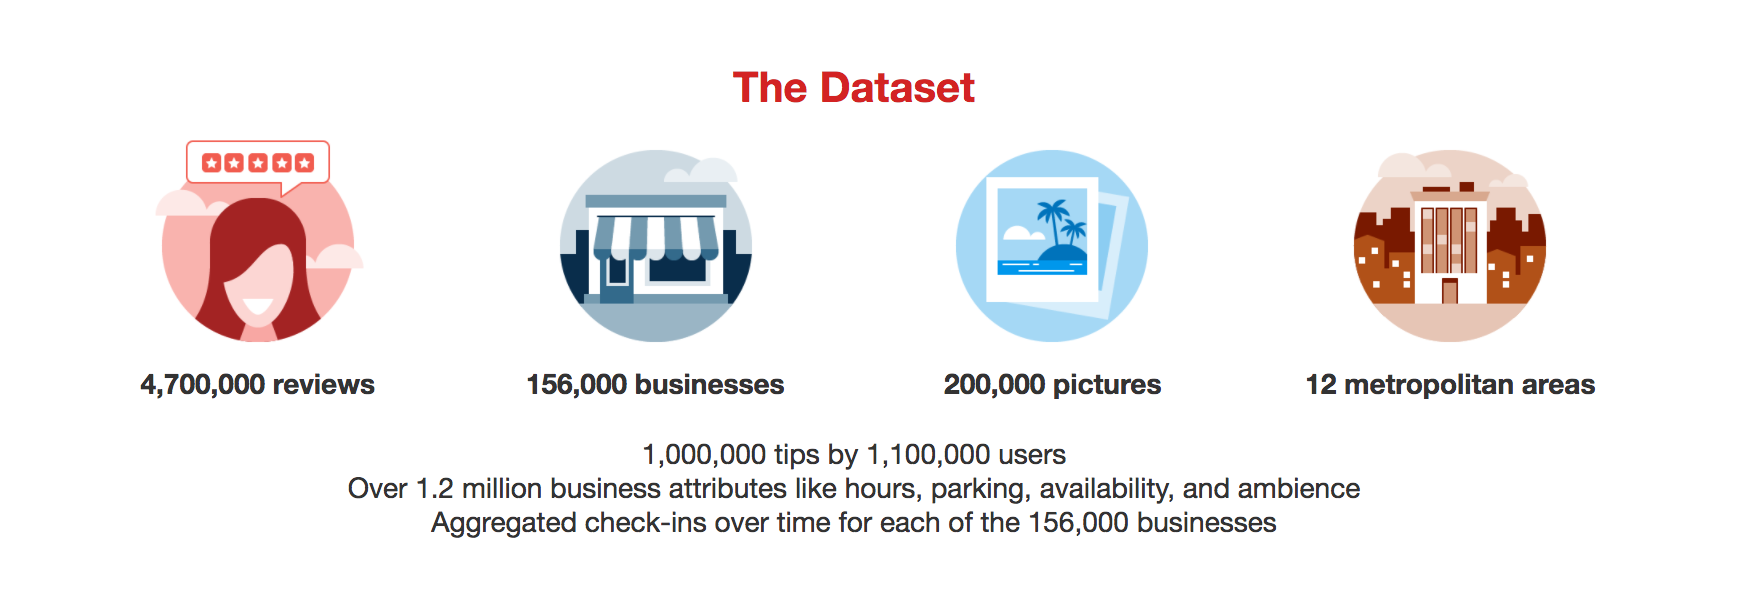
The whole dataset includes 6 files: business.json, review.json, photos.json, checkin.json, user.json and tip.json. I will go on and just make use of the first two files to extract the review text, rating stars categories and the corresponding business IDs within this exploration. I will try add more features in, such as the number of usefullness of a review, which would be more interesting.
Based on these data, I am curious about what words people would use when leaving a 5-star review for restaurants, such as an Asian fusion restaurant. And also I would like to find out what specific aspects people were not satisfied with from the most frequently used words when they left 1-star reviews.
Once I start my modeling work later, detecting if a review is fake or predicting the possibility of receiving a 5-star rating in the near future would be my options to perform.
Reference
Yelp Challenge Dataset: https://www.yelp.com/dataset/challenge
{
string, 22 character unique review id
"review_id": "zdSx_SD6obEhz9VrW9uAWA",
string, 22 character unique user id, maps to the user in user.json
"user_id": "Ha3iJu77CxlrFm-vQRs_8g",string, 22 character business id, maps to business in business.json
"business_id": "tnhfDv5Il8EaGSXZGiuQGg",integer, star rating
"stars": 4,string, date formatted YYYY-MM-DD
"date": "2016-03-09",string, the review itself
"text": "Great place to hang out after work: the prices are decent, and the ambience is fun. It's a bit loud, but very lively. The staff is friendly, and the food is good. They have a good selection of drinks.",integer, number of useful votes received
"useful": 0,integer, number of funny votes received
"funny": 0,integer, number of cool votes received
"cool": 0 }2.2 yelp_academic_dataset_businesses.json
Contains business data including location data, attributes, and categories.
In this analysis, we will use the 'categories' and 'business_id'.
{
string, 22 character unique string business id
"business_id": "tnhfDv5Il8EaGSXZGiuQGg",string, the business's name
"name": "Garaje",string, the neighborhood's name
"neighborhood": "SoMa",string, the full address of the business
"address": "475 3rd St",string, the city
"city": "San Francisco",......
......
......
an array of strings of business categories
"categories": [ "Mexican", "Burgers", "Gastropubs" ],an object of key day to value hours, hours are using a 24hr clock
"hours": { "Monday": "10:00-21:00", "Tuesday": "10:00-21:00", "Friday": "10:00-21:00", "Wednesday": "10:00-21:00", "Thursday": "10:00-21:00", "Sunday": "11:00-18:00", "Saturday": "10:00-21:00" } }import csv
import json
import sys
# extract reviews, rating stars and business id
# open for writting
outfile_reviews = open("review_with_id.csv",'w',newline='')
sfile_reviews = csv.writer(outfile_reviews, delimiter =",", quoting=csv.QUOTE_MINIMAL)
sfile_reviews.writerow(['business_id','stars', 'text'])
with open('yelp_academic_dataset_review.json') as reviews:
for line in reviews:
row = json.loads(line)
# some special char must be encoded in 'utf-8'
sfile_reviews.writerow([row['business_id'],row['stars'], (row['text']).encode('utf-8')])
outfile_reviews.close()
- Extract attributes, 'business_id', 'stars' and 'text', from _yelp_academic_datasetreviews.json.
# extract business id and coresponding categories
# open for writting
outfile_categories = open("category_with_id.csv",'w',newline='')
sfile_categories = csv.writer(outfile_categories, delimiter =",", quoting=csv.QUOTE_MINIMAL)
sfile_categories.writerow(['business_id','categories'])
with open('yelp_academic_dataset_business.json') as businesses:
    for line in businesses:
        row = json.loads(line)
        # some special char must be encoded in 'utf-8'
        sfile_categories.writerow([row['business_id'],(row['categories'])])
outfile_categories.close()
Let's take a look at what the data looks like.
import pandas as pd
import numpy as np
import seaborn as sns
import matplotlib as plt
import warnings

df_review_with_id = pd.read_csv('review_with_id.csv')
df_review_with_id.head()
df_category_with_id = pd.read_csv('category_with_id.csv')
df_category_with_id.head()
df_category_with_id.info()
df_review_with_id.info()
Great! That's what we want.
Now we need to Merge the two CSV files according to 'business_id'.
df = pd.merge(df_review_with_id,df_category_with_id, on="business_id", how="outer")
df.head()
df.info()
pd.isnull(df['stars']) == True
There is a large amount of data. We will just make use of the first 500000 of them.
df = df[0:499999]
df.info()
from nltk import word_tokenize
from nltk.corpus import stopwords
#nltk.download()
stop = set(stopwords.words('english'))
df['text_without_stopwords'] =df['text'].apply(lambda x: ' '.join([word for word in x.split() if word not in (stop)]))
# [i for i in word_tokenize(sentence.lower()) if i not in stop]
print(df['text_without_stopwords'][100])
from sklearn.feature_extraction.text import CountVectorizer
n_features = 1000
count_vect = CountVectorizer(max_df=0.95, min_df=2, max_features=n_features, stop_words='english')
summary_text = df['text_without_stopwords']
# Learn the vocabulary dictionary and return term-document matrix.
bag_words = count_vect.fit_transform(summary_text)
print(bag_words.shape) # this is a sparse matrix
print('=========')
print(bag_words[0])
print(len(count_vect.vocabulary_))
print(count_vect.vocabulary_)
## Convert the data into a sparse encoded tf-idf representation.
from sklearn.feature_extraction.text import TfidfVectorizer

tfidf_vectorizer = TfidfVectorizer(max_df=0.95, min_df=2,max_features=n_features,stop_words='english')
tfidf = tfidf_vectorizer.fit_transform(summary_text)
print(tfidf.shape) # this is a sparse matrix
print('=========')
print(bag_words[0])
print(len(tfidf_vectorizer.vocabulary_))
print(tfidf_vectorizer.vocabulary_)
df_cv = pd.DataFrame(data=bag_words.toarray(),columns=count_vect.get_feature_names())
df['length_of_text'] = df['text'].map(lambda x: len(x))
word_fre = df_cv.sum().sort_values()[-15:]/df['length_of_text'].sum()
import matplotlib.pyplot as plt
import matplotlib.patches as mpatches
import matplotlib
%matplotlib inline
import seaborn as sns

plt.style.use('ggplot')
ax = word_fre.plot(kind='barh')
plt.title('15 Most Common Words Frequency', color='black')

# just print them out for convenience
print(plt.style.available)
Let's find out what businesses are given longer reviews by customers.
%matplotlib inline
plt.style.use('seaborn')
df_categoryIndex = df.set_index('categories')
ax = df_categoryIndex['length_of_text'].sort_values()[-15:].plot(kind='barh')
plt.title('15 Longest Reviews')

People are giving longer reviews for Japenese or Sushi restaurants. Let's take a closer look at it. More positive ones or negative ones?
However, both of them didnt give us much meaningful information.
So we need to do this sepecifically.
4.2 Japanese Sushi Restaurant and Pho
import seaborn as sns
g = sns.countplot(df.stars[df.categories.str.contains("Japanese', 'Sushi")])
#g.set(xticklabels=[])
plt.xticks(rotation=90) # Number of reviews in each rating level

import seaborn as sns
g = sns.countplot(df.stars[df.categories.str.contains("Pho")])
#g.set(xticklabels=[])
plt.xticks(rotation=90) # Number of reviews in each rating level

It seems that people left more negtive reviews for Pho restaurants, but also more positive ones.
4.3 Number of reviews in each rating level
import seaborn as sns
g = sns.countplot(df.stars)
plt.xticks(rotation=90) # Number of reviews in each rating level

People seem more likely to give a high rating.
Let's plot the length of reviews which are 5-star rated.
g = sns.countplot(df['length_of_text'][df.stars == 5])
g.set(xticklabels=[])
plt.xticks(rotation=90) # Number of reviews in each rating level

df['length_of_text'][df.stars == 5].describe()
We choose the reviews with 5 rating stars to see how long a review most people left if they had a great experience. We can see that lengths of words between 364 and 639 are most common.
Let's also take a look at the situation for 1-star rated reviews.
g = sns.countplot(df['length_of_text'][df.stars == 1])
g.set(xticklabels=[])
plt.xticks(rotation=90) # Number of reviews in each rating level

df['length_of_text'][df.stars == 1].describe()
People were really upset and used more words to describe their bad experience!
4.4 most common relevant words
What words people used frequently when they left a 5-star review for a modern european restaurants.
df.head(-100)
from sklearn.feature_extraction.text import CountVectorizer
n_features = 1000
count_vect_5 = CountVectorizer(max_df=0.95, min_df=2, max_features=n_features, stop_words='english')
summary_text_5 = df['text_without_stopwords'][(df.stars == 5) & df.categories.str.contains("Modern European', 'Restaurants")]
# Learn the vocabulary dictionary and return term-document matrix.
bag_words_5 = count_vect_5.fit_transform(summary_text_5)
print(len(count_vect_5.vocabulary_))
print(count_vect_5.vocabulary_)
count_vect_5.inverse_transform(bag_words_5[0])
pd.options.display.max_columns = 999
df_5 = pd.DataFrame(data=bag_words_5.toarray(),columns=count_vect_5.get_feature_names())
# print out 10 most common words in our data
df_5.sum().sort_values()[-10:]
# print out 10 least common words in our data
df_5.sum().sort_values()[:10] # small sample size means most words occur one time
# Convert dataframe into string
summary_text_5_array = np.array(summary_text_5)
summary_text_5_str = np.array2string(summary_text_5_array)

# Generate a word cloud image
wordcloud_5 = WordCloud(max_font_size=40,background_color='white',width=500, height=250,colormap = 'plasma').generate(summary_text_5_str)

# Display the generated image:
plt.imshow(wordcloud)
plt.axis("off")

We can find may big positive words above. People are very generous with their compliments when having a great experience.
What words people used frequently when they left a 1-star review for a modern european restaurants.
count_vect_1 = CountVectorizer(max_df=0.95, min_df=2, max_features=n_features, stop_words='english')
summary_text_1 = df['text_without_stopwords'][(df.stars == 1) & df.categories.str.contains("Modern European', 'Restaurants")]
# Learn the vocabulary dictionary and return term-document matrix.
bag_words_1 = count_vect_1.fit_transform(summary_text_1)
count_vect_1.inverse_transform(bag_words_1[0])
pd.options.display.max_columns = 999
df_1 = pd.DataFrame(data=bag_words_1.toarray(),columns=count_vect_1.get_feature_names())
# print out 10 most common words in our data
df_1.sum().sort_values()[-10:]
# print out 10 least common words in our data
df_1.sum().sort_values()[:10] # small sample size means most words occur one time
# Convert dataframe into string
summary_text_1_array = np.array(summary_text_1)
summary_text_1_str = np.array2string(summary_text_1_array)

# Generate a word cloud image
wordcloud = WordCloud(max_font_size=40,background_color='white',width=500, height=250,colormap = 'plasma').generate(summary_text_1_str)

# Display the generated image:
plt.imshow(wordcloud)
plt.axis("off")

There are not many negative words as I expected. That's cool. People are friendly. And I would think that those bigger words represent the aspects in which the restaurants did bad.
Exceptional Work
# Exception work
from os import path
from wordcloud import WordCloud
# Convert dataframe into string
#summary_text = df['text_without_stopwords']
summary_text_array = np.array(summary_text[df.stars == 5])
summary_text_str = np.array2string(summary_text_array)

# lower max_font_size
wordcloud = WordCloud(max_font_size=40,background_color='white',width=500, height=250,colormap = 'magma').generate(summary_text_str)
plt.figure()
plt.imshow(wordcloud)
plt.axis("off")
plt.show()